kitesurf, wingfoil and windsurf spots in Canada
438 spots listed, across 16 regions. Rideable days are computed from two full years of readings (2024 and 2025), spot by spot.
By region
When to ride
2024-2025 average| Region | J | F | M | A | M | J | J | A | S | O | N | D |
|---|---|---|---|---|---|---|---|---|---|---|---|---|
| Ontario 106 | 16 | 14 | 17 | 17 | 16 | 16 | 17 | 17 | 12 | 15 | 15 | 16 |
| Québec 99 | 16 | 15 | 18 | 18 | 18 | 18 | 16 | 15 | 15 | 16 | 16 | 15 |
| British Columbia 44 | 6 | 7 | 10 | 14 | 15 | 14 | 15 | 12 | 10 | 10 | 7 | 8 |
| Manitoba 40 | 18 | 16 | 19 | 20 | 22 | 22 | 20 | 20 | 18 | 19 | 17 | 18 |
| Alberta 39 | 15 | 12 | 14 | 17 | 19 | 16 | 15 | 15 | 14 | 18 | 13 | 16 |
| Nova Scotia 21 | 21 | 19 | 23 | 21 | 21 | 20 | 21 | 21 | 19 | 20 | 20 | 20 |
| Nouveau-Brunswick 20 | 24 | 22 | 22 | 23 | 23 | 22 | 24 | 23 | 22 | 22 | 23 | 22 |
| Saskatchewan 17 | 23 | 22 | 22 | 25 | 25 | 24 | 22 | 23 | 22 | 25 | 21 | 23 |
The windiest spots
2024-2025 average| Spot | Region | Rideable days |
|---|---|---|
| Petite Baie | Québec | 358 d/yr |
| Pointe-aux-Loups Flat Spot | Québec | 358 d/yr |
| Iles de la Madeleine | La Lagune | Québec | 353 d/yr |
| La Chaloupe | Québec | 353 d/yr |
| Gros Cap, Iles de la Madeleine | Québec | 348 d/yr |
| Prince Edward Island | Princetown Point | Prince Edward Island | 334 d/yr |
| Boundary Dam | Saskatchewan | 333 d/yr |
| Kenosee Lake | Saskatchewan | 332 d/yr |
| Portage du Cap | Québec | 331 d/yr |
| Nickle Lake Regional Park | Saskatchewan | 326 d/yr |
Average rideable days per year, computed from 2024-2025 readings. A day counts as rideable when it has at least two consecutive hours of wind at 7 knots or more, blowing from a direction that works for the spot.
All spots
438 spots-
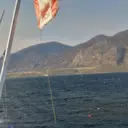 Osoyoos Lake | Osoyoos
British Columbia
220 d/yr
Kitesurf · Wingfoil · Lake
-
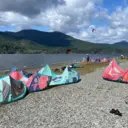 Lake Nitinaht
British Columbia
146 d/yr
Kitesurf · Wingfoil · Lake
-
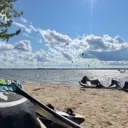 Lac des Deux Montagnes | Crete d Oka
Québec
104 d/yr
Kitesurf · Wingfoil · Lake
-
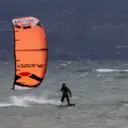 Miscou Island | Camping Gionet
Nouveau-Brunswick
537 d/yr
Kitesurf · Wingfoil · Sea
-
Sandbanks Provincial Park
Ontario
468 d/yr
Kitesurf · Wingfoil · Lake
-
Sherkston
Ontario
411 d/yr
Kitesurf · Wingfoil · Lake
-
Petite Baie
Québec
358 d/yr
Kitesurf · Wingfoil · Sea
-
Pointe-aux-Loups Flat Spot
Québec
358 d/yr
Kitesurf · Wingfoil · Sea
-
Iles de la Madeleine | La Lagune
Québec
353 d/yr
Kitesurf · Wingfoil · Sea
-
La Chaloupe
Québec
353 d/yr
Kitesurf · Wingfoil · Sea
-
Gros Cap, Iles de la Madeleine
Québec
348 d/yr
Surf · Kitesurf · Sea
-
Prince Edward Island | Princetown Point
Prince Edward Island
334 d/yr
Kitesurf · Sea
-
Boundary Dam
Saskatchewan
333 d/yr
Kitesurf · Lake
-
Kenosee Lake
Saskatchewan
332 d/yr
Kitesurf · Lake
-
Portage du Cap
Québec
331 d/yr
Kitesurf · Wingfoil · Sea
-
Nickle Lake Regional Park
Saskatchewan
326 d/yr
Kitesurf · Lake
-
Jeddore
Nova Scotia
325 d/yr
Kitesurf · Sea
-
raferty dam
Saskatchewan
324 d/yr
Kitesurf · Lake
-
Blackstrap
Saskatchewan
322 d/yr
Kitesurf · Lake
-
Manhattan Beach
Manitoba
322 d/yr
Kitesurf · Lake
-
Raferty Dam
Saskatchewan
322 d/yr
Kitesurf · Lake
-
Île d'Orléans
Québec
320 d/yr
Kitesurf · Wingfoil · Sea
-
East Shoal Lake
Manitoba
320 d/yr
Kitesurf · Lake
-
Fernwood
Île-du-Prince-Édouard
316 d/yr
Kitesurf · Wingfoil · Sea
Sports, by number of spots
- Kitesurf 425
- Wingfoil 267
- Windsurf 166
- Snowkite 13
- Surf 11
- Paddle 1
- Windfoil 1